NSD ARCHITECTURE DAY01
- 案例1:安装Elasticsearch
- 案例2:部署Elasticsearch集群
- 案例3:安装Elasticsearch插件
- 案例4:熟悉Elasticsearch的API调用
- 案例5:安装Kibana
- 案例6:导入日志并绘制图表
1 案例1:安装Elasticsearch
1.1 问题
本案例要求:
- 创建虚拟机并安装 elasticsearch
- 最低配置: 2cpu,2G内存,20G硬盘
- 虚拟机:192.168.1.41 es-0001
1.2 方案
1)ELK是日志分析平台,不是一款软件,而是一整套解决方案,是三个软件产品的首字母缩写,ELK分别代表:
Elasticsearch:负责日志检索和储存
Logstash:负责日志的收集和分析、处理
Kibana:负责日志的可视化
2) ELK组件在海量日志系统的运维中,可用于解决分布式日志数据集中式查询和管理系统监控等,故障排查,安全信息和事件管理,报表功能
部署Elasticsearch分布式集群安装,Kibana作为可视化平台,实时总结流量和数据的图表,Logstash用来收集处理日志
1.3 步骤
实现此案例需要按照如下步骤进行。
步骤一:先准备一台虚拟机
1)更改主机名,配置IP,搭建第三方yum源
- # 在跳板机上把 elk 软件加入自定义 yum 仓库
- [root@ecs-proxy ~]# cp -a elk /var/ftp/localrepo/elk
- [root@ecs-proxy ~]# cd /var/ftp/localrepo/
- [root@ecs-proxy localrepo]# createrepo --update .
2)安装elasticsearch
- # 配置主机名解析
- [root@es-0001 ~]# vim /etc/hosts
- 192.168.1.41 es-0001
- [root@es-0001 ~]# yum makecache
- [root@es-0001 ~]# yum install -y java-1.8.0-openjdk elasticsearch
- [root@es-0001 ~]# vim /etc/elasticsearch/elasticsearch.yml
- 55: network.host: 0.0.0.0
- [root@es-0001 ~]# systemctl enable --now elasticsearch
- [root@es-0001 ~]# curl http://192.168.1.41:9200/
- {
- "name" : "War Eagle",
- "cluster_name" : "elasticsearch",
- "version" : {
- "number" : "2.3.4",
- "build_hash" : "e455fd0c13dceca8dbbdbb1665d068ae55dabe3f",
- "build_timestamp" : "2016-06-30T11:24:31Z",
- "build_snapshot" : false,
- "lucene_version" : "5.5.0"
- },
- "tagline" : "You Know, for Search"
- }
2 案例2:部署Elasticsearch集群
2.1 问题
本案例要求:
- 使用5台虚拟机组建 elasticsearch 集群
- 最低配置: 2cpu,2G内存,20G硬盘
- 虚拟机:
- 192.168.1.41 es-0001
- 192.168.1.42 es-0002
- 192.168.1.43 es-0003
- 192.168.1.44 es-0004
- 192.168.1.45 es-0005
2.2 步骤
实现此案例需要按照如下步骤进行。
步骤一:更改hosts文件,更改配置文件
1)更改hosts文件
- [root@es-0001 ~]# vim /etc/hosts
- 192.168.1.41 es-0001
- 192.168.1.42 es-0002
- 192.168.1.43 es-0003
- 192.168.1.44 es-0004
- 192.168.1.45 es-0005
2)更改配置文件
- [root@es-0001 ~]# yum install -y java-1.8.0-openjdk elasticsearch
- [root@es-0001 ~]# vim /etc/elasticsearch/elasticsearch.yml
- 17: cluster.name: my-es
- 23: node.name: es-0001 # 本机主机名
- 55: network.host: 0.0.0.0
- 68: discovery.zen.ping.unicast.hosts: ["es-0001", "es-0002"]
- [root@es-0001 ~]# systemctl enable --now elasticsearch
- [root@es-0001 ~]# curl http://192.168.1.41:9200/_cluster/health?pretty
- {
- "cluster_name" : "my-es",
- "status" : "green",
- "timed_out" : false,
- "number_of_nodes" : 5,
- "number_of_data_nodes" : 5,
- ... ...
- }
3) 其他机器(1.42-1.45)一样操作,安装elasticsearch和java-1.8.0-openjdk,同步配置文件在步骤一已经安装了一台elasticsearch,这里只需再准备四台即可
4)访问测试,如图-1所示:
可以访问任意一台主机, 集群的节点都是5台,ES 集群验证:返回字段解析:
”status”: ”green“ 集群状态:绿色为正常、黄色表示有问题但不是很严重、红色表示严重故障
”number_of_nodes”: 5, 表示集群中节点的数量
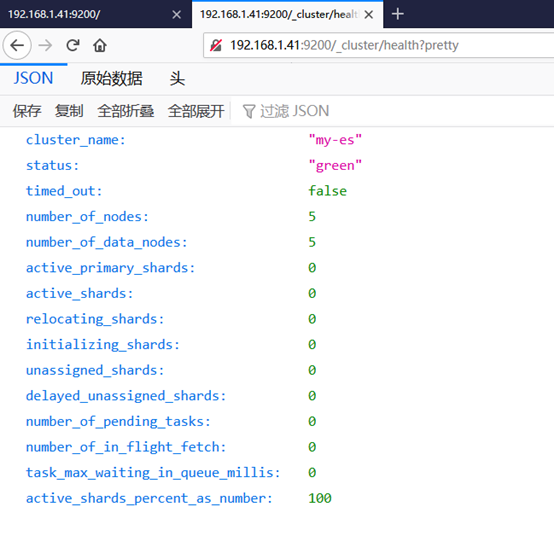
图-1
3 案例3:安装Elasticsearch插件
3.1 问题
本案例要求:
- 使用 head插件访问集群
- 购买云主机: 1cpu,1G内存,20G硬盘,并安装 apache
- 虚拟机:
- 192.168.1.48 web
实现此案例需要按照如下步骤进行。
步骤一:部署插件
安装 apache,并把 apache 和 es-0001 服务发布到互联网上
安装 apache
- [root@web ~]# yum install -y httpd
- [root@web ~]# tar zxf head.tar.gz
- [root@web ~]# mv elasticsearch-head /var/www/html/head
- [root@web ~]# systemctl enable --now httpd
- Created symlink from /etc/systemd/system/multi-user.target.wants/httpd.service to /usr/lib/systemd/system/httpd.service.
- [root@web ~]#
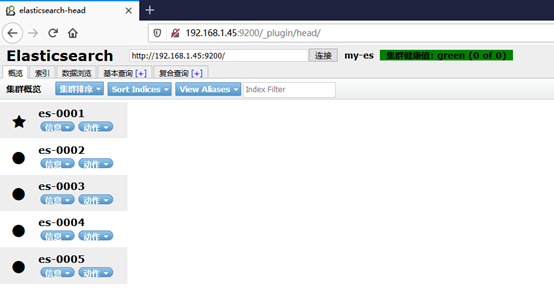
2)授权访问head插件访问 es-0001,如图-2所示:
- [root@es-0001 ~]# vim /etc/elasticsearch/elasticsearch.yml
- # 配置文件最后追加
- http.cors.enabled : true
- http.cors.allow-origin : "*"
- http.cors.allow-methods : OPTIONS, HEAD, GET, POST, PUT, DELETE
- http.cors.allow-headers : X-Requested-With,X-Auth-Token,Content-Type,Content-Length
- [root@es-0001 ~]# systemctl restart elasticsearch.service
4 案例4:熟悉Elasticsearch的API调用
4.1 问题
本案例要求:
- 熟悉Elasticsearch的Api调用
- 增:PUT
- 删:DELETE
- 改:POST
- 查:GET
4.2 步骤
实现此案例需要按照如下步骤进行。
步骤一:创建 tedu 索引使用 PUT 方式
- [root@es-0005 bin]# curl -XPUT -H "Content-Type: application/json" 'http://es-0001:9200/tedu' -d '{
- "settings":{
- "index":{
- "number_of_shards": 5,
- "number_of_replicas": 1
- }
- }
- }'
- {"acknowledged":true}
步骤二:增加数据
- [root@es-0005 bin]# curl –XPUT -H "Content-Type: application/json" 'http://es-0001:9200/tedu/teacher/1' -d \
- > '{
- > "职业": "诗人",
- > "名字": "李白",
- > "称号": "诗仙",
- > "年代": "唐"
- > }'
- {"_index":"tedu","_type":"teacher","_id":"1","_version":1,"_shards":{"total":2,"successful":2,"failed":0},"created":true}
步骤三:查询数据
- [root@es-0005 bin]# curl -XGET http://es-0001:9200/tedu/teacher/1?pretty
- {
- "_index" : "tedu",
- "_type" : "teacher",
- "_id" : "1",
- "_version" : 1,
- "found" : true,
- "_source" : {
- "职业" : "诗人",
- "名字" : "李白",
- "称号" : "诗仙",
- "年代" : "唐"
- }
- }
步骤四:修改数据
- [root@es-0005 bin]# curl -XPOST -H "Content-Type: application/json" http://es-0001:9200/tedu/teacher/1/_update -d \
- > '{
- > "doc": {
- > "年代": "公元701"
- > }
- > }'
- {"_index":"tedu","_type":"teacher","_id":"1","_version":2,"_shards":{"total":2,"successful":2,"failed":0}}
步骤五:删除数据
注:删除时候可以是文档,也可以是索引,但不能是类型
- [root@es-0005 bin]# curl –XDELETE -H "Content-Type: application/json" http://es-0001:9200/tedu/teacher/1
- {"found":true,"_index":"tedu","_type":"teacher","_id":"1","_version":3,"_shards":{"total":2,"successful":2,"failed":0}}
- [root@es-0005 bin]# curl -XDELETE -H "Content-Type: application/json" http://es-0001:9200/tedu
- {"acknowledged":true}[root@es-0005 bin]#
- [root@es-0005 bin]#
5 案例5:安装Kibana
5.1 问题
本案例要求批量导入数据:
- 创建虚拟机并安装 kibana
- 最低配置: 1cpu,1G内存,10G硬盘
- 虚拟机IP: 192.168.1.46 kibana
5.2 步骤
实现此案例需要按照如下步骤进行。
步骤一:安装kibana
1)在另一台主机,配置ip为192.168.1.46,配置yum源,更改主机名
2)安装kibana
- 更改hosts文件
- [root@kibana ~]# vim /etc/hosts
- 192.168.1.41 es-0001
- 192.168.1.42 es-0002
- 192.168.1.43 es-0003
- 192.168.1.44 es-0004
- 192.168.1.45 es-0005
- 192.168.1.46 kibana
- [root@kibana ~]# yum -y install kibana
3)更改配置文件
- [root@kibana ~]# yum install -y kibana
- [root@kibana ~]# vim /etc/kibana/kibana.yml
- 02 server.port: 5601
- 07 server.host: "0.0.0.0"
- 28 elasticsearch.hosts: ["http://es-0002:9200", "http://es-0003:9200"]
- 37 kibana.index: ".kibana"
- 40 kibana.defaultAppId: "home"
- 113 i18n.locale: "zh-CN"
- [root@kibana ~]# systemctl enable --now kibana
步骤二:web 页面访问,如图-5所示:
- Firefox http://192.168.1.46:5601
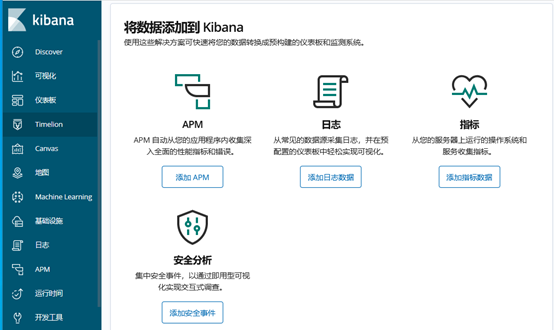
图-5
6 案例6:导入日志并绘制图表
6.1 问题
本案例要求批量导入数据:
- 导入日志,并绘制图表
- 导入 logs 日志
- 绘制流量图和饼图
6.2 步骤
实现此案例需要按照如下步骤进行。
步骤一:导入数据
- [root@localhost ~]# scp /var/ftp/localrepo/elk/*.gz root@192.168.1.46:/root/
- [root@kibana ~]# gzip -d logs.jsonl.gz
- [root@kibana ~]# curl -XPOST -H "Content-Type: application/json" http://es-0001:9200/_bulk --data-binary @logs.jsonl
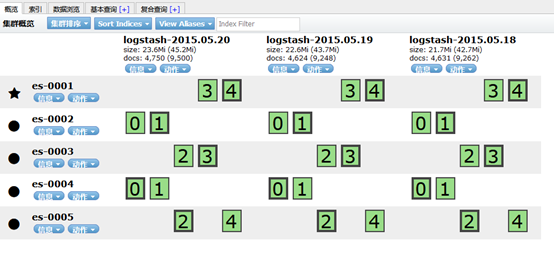
图-6
3)kibana导入数据,如图-7所示:
- firefox http://192.168.1.46:5601
3)成功创建会有logstash-*,如图-7所示:
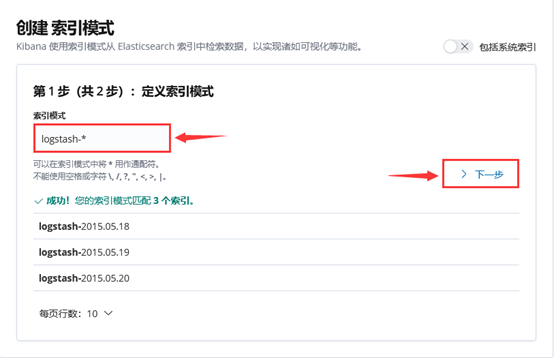
图-7
注意: 这里没有数据的原因是导入日志的时间段不对,默认配置是最近15分钟,在这可以修改一下时间来显示
5)kibana修改时间,选择Lsat 15 miuntes
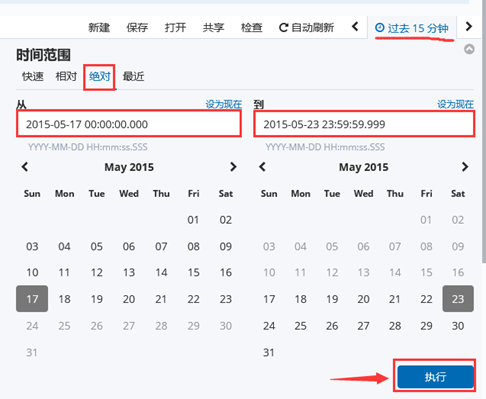
图-8
7)选择时间2015-5-15到2015-5-22,如图-12所示:
8)查看结果,如图-9所示:
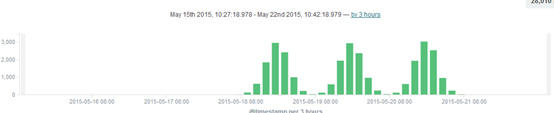
图-9
9)除了柱状图,Kibana还支持很多种展示方式 ,如图-10所示:
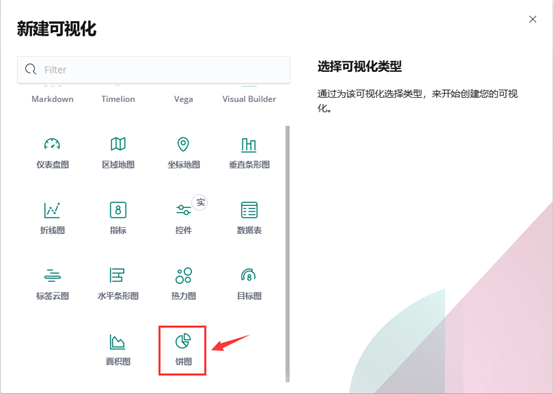
图-10
10)做一个饼图,选择Pie chart,如图-11所示:
11)结果,如图-11所示:
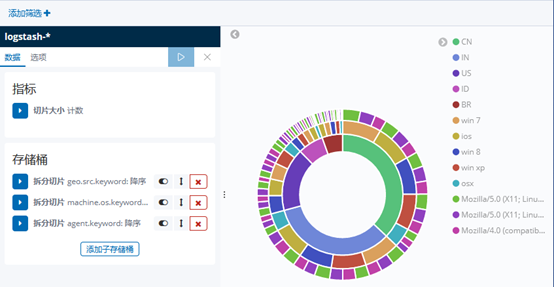
图-11